Goal
Read a file (e.g., csv) and save the plot to a local directory (same path).
Table of Contents
Prerequisites
-
KadiStudio is installed and running.
- See: Installation Guide
-
Tools are downloaded and available.
- See: in progress
-
You are familiar with Built-in Nodes and Environment Nodes.
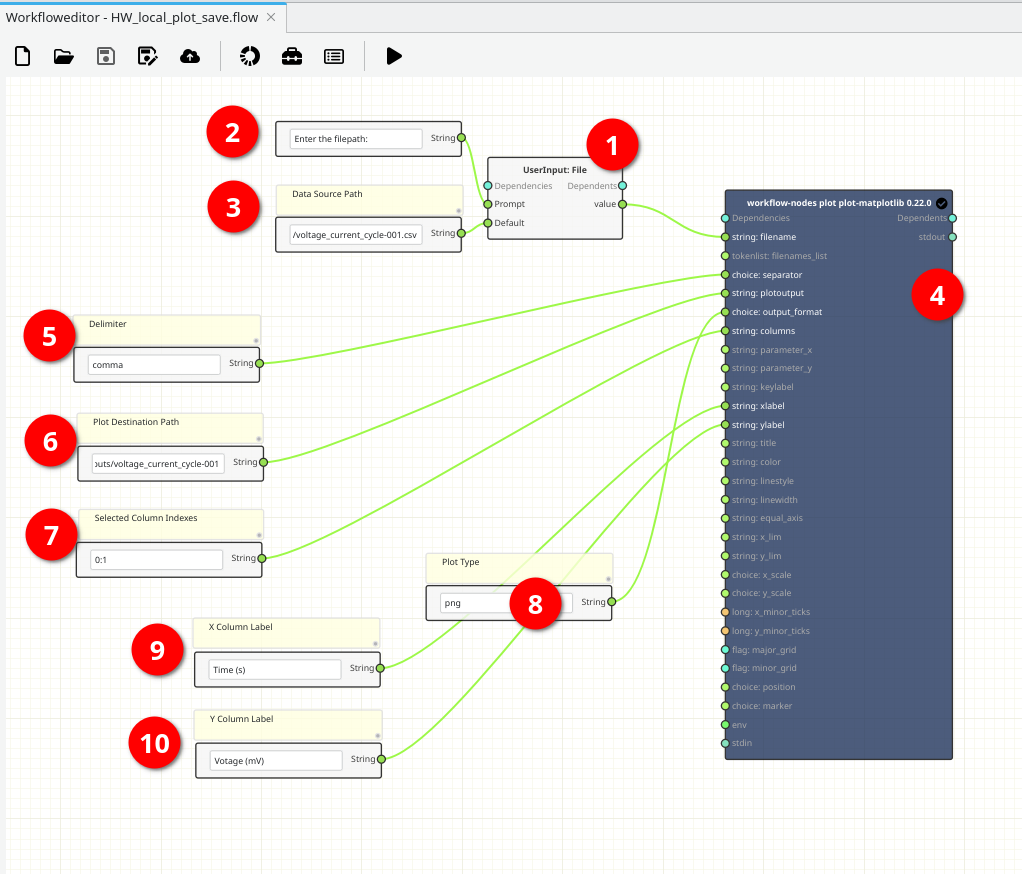
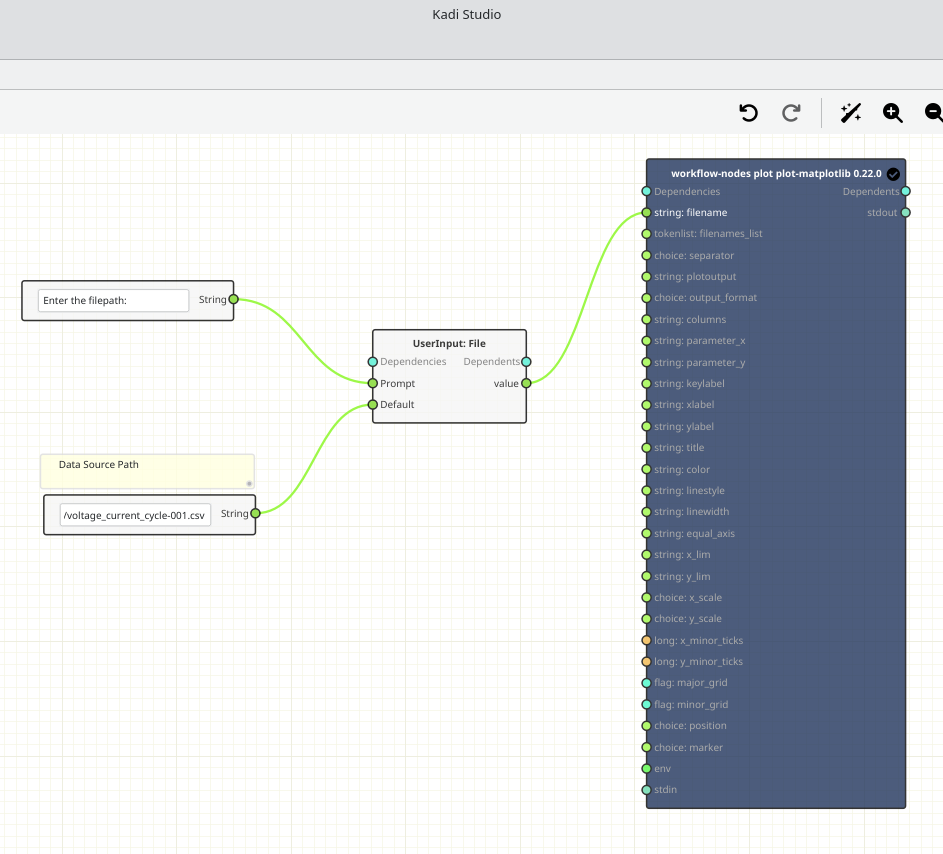
Final Workflow
The figure below shows the final layout of the workflow.
Creating and Filling out
1- [Node 1] - Add a UserInput File Node
-
How:
- In the workspace, right-click and select Add User Input → UserInputFile (Built-in Node).
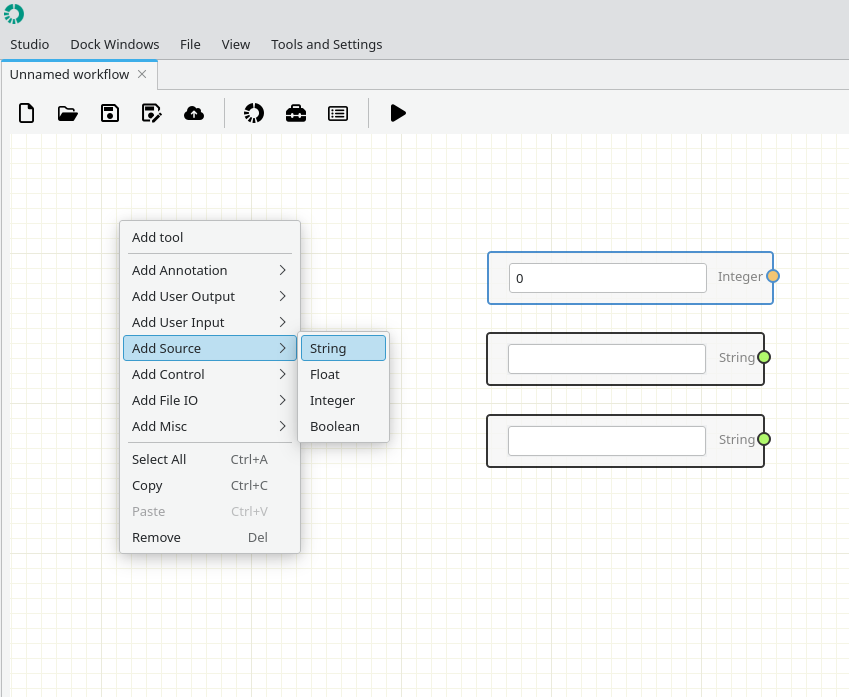
2- Add and fill out Source Text Nodes (Variables)
-
How:
- In the workspace, right-click and select Add Source → String (2, 3, 5, 6, 7, 8, 9, 10).
- Node 2 : Prompt.
- Node 3 : Load Data Source Path.
- Node 5 : Set Delimiter. The default is "Tab"
- Node 6 : Plot Destination Path (Mandatory).
- Node 7 : Selected Column Indexes. (Mandatory)
- Node 8 : Select Plot Type (.svg, .pdf, *.png, ...). The default is "pdf"
- Node 9 : Set X Column Label (optional)
- Node 10: Set Y Column Label (optional)
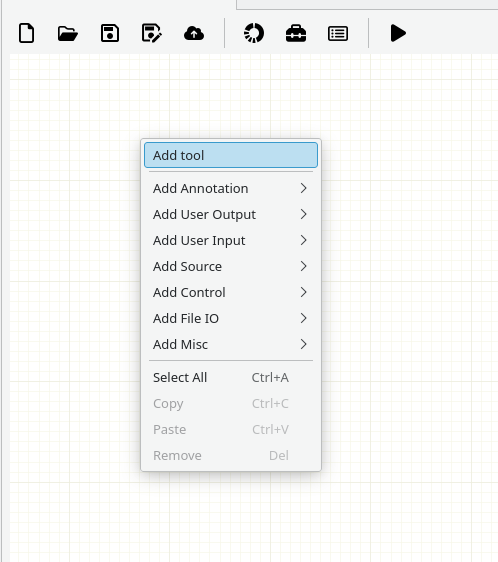
3- [Node 4] - Add a workflow-nodes plot matplotlib Node
-
Where to read more:
https://workflow-nodes.readthedocs.io/en/stable/usage/cli.html#workflow-nodes-plot-plot-matplotlib
-
How:
- In the workspace, right-click and from Add tool (Top), search plot and select workflow-nodes plot plot-matplotlib (Bottom).

Connection
- Pay attention to the ports colors.
- Integer ports (light orange). Not for this case.
- Strings (light green)
Running
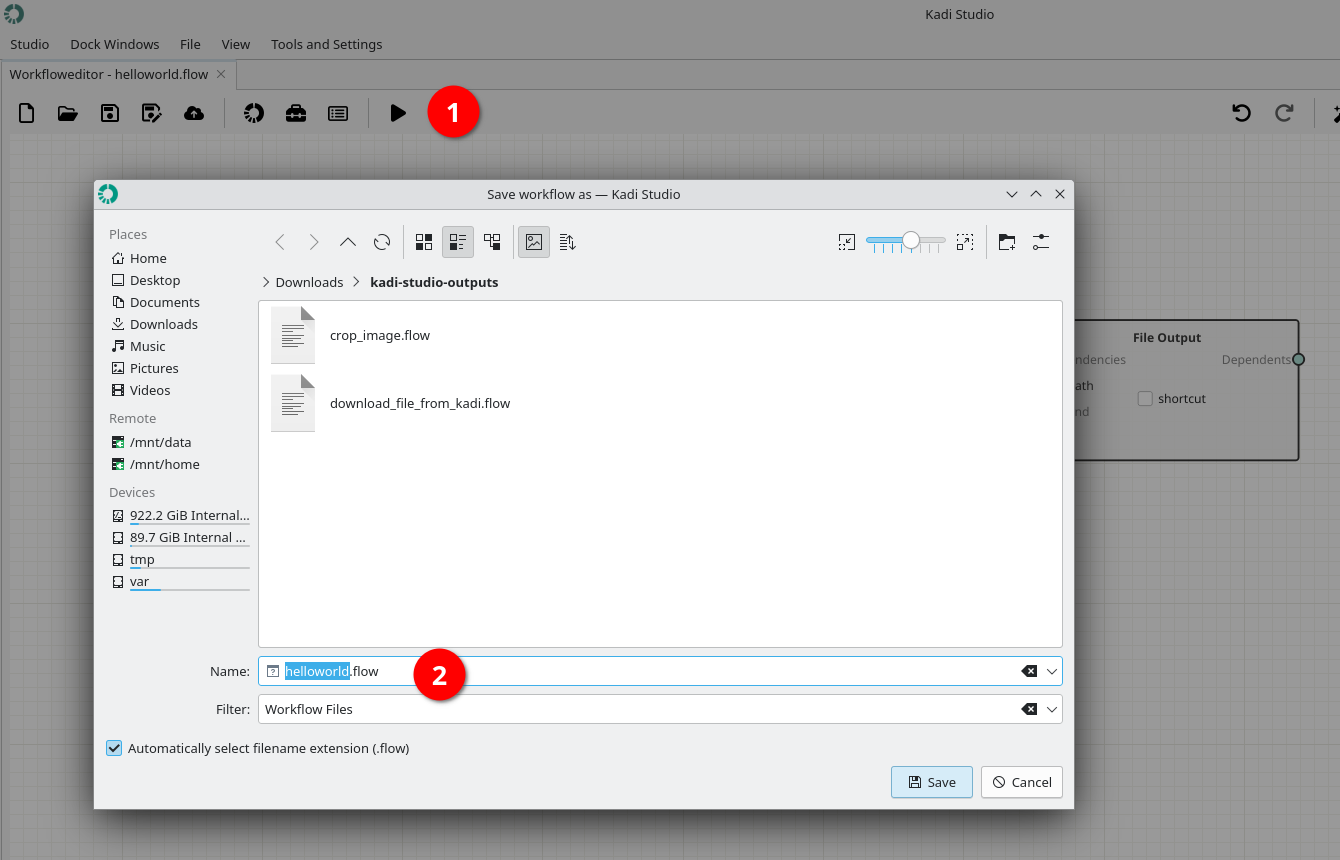
1- Save the workflow by pushing Play button.
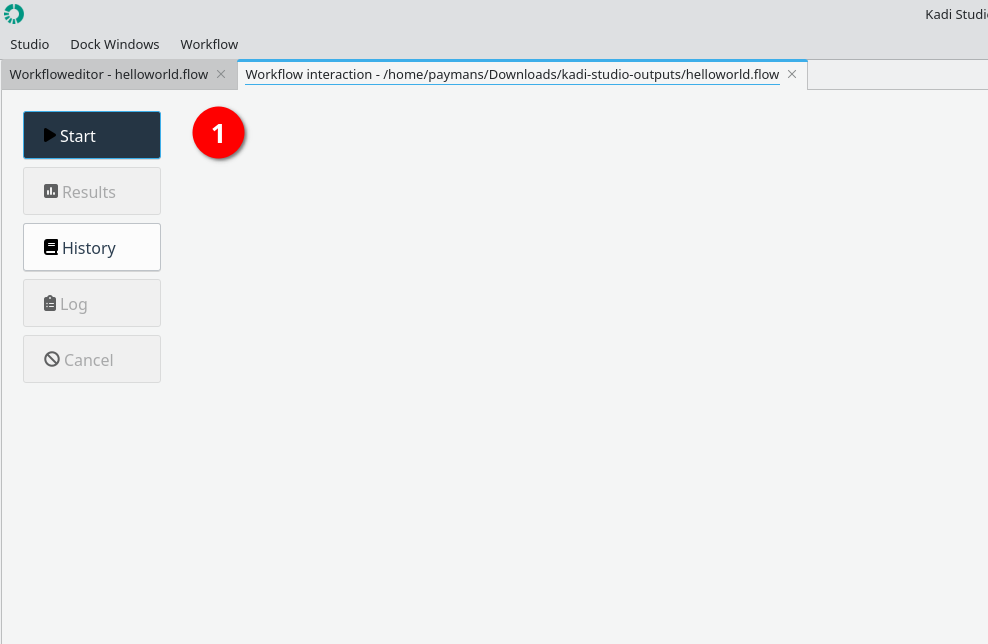
2- Start running the workflow by using Start button.
3- Enter the plot file path.
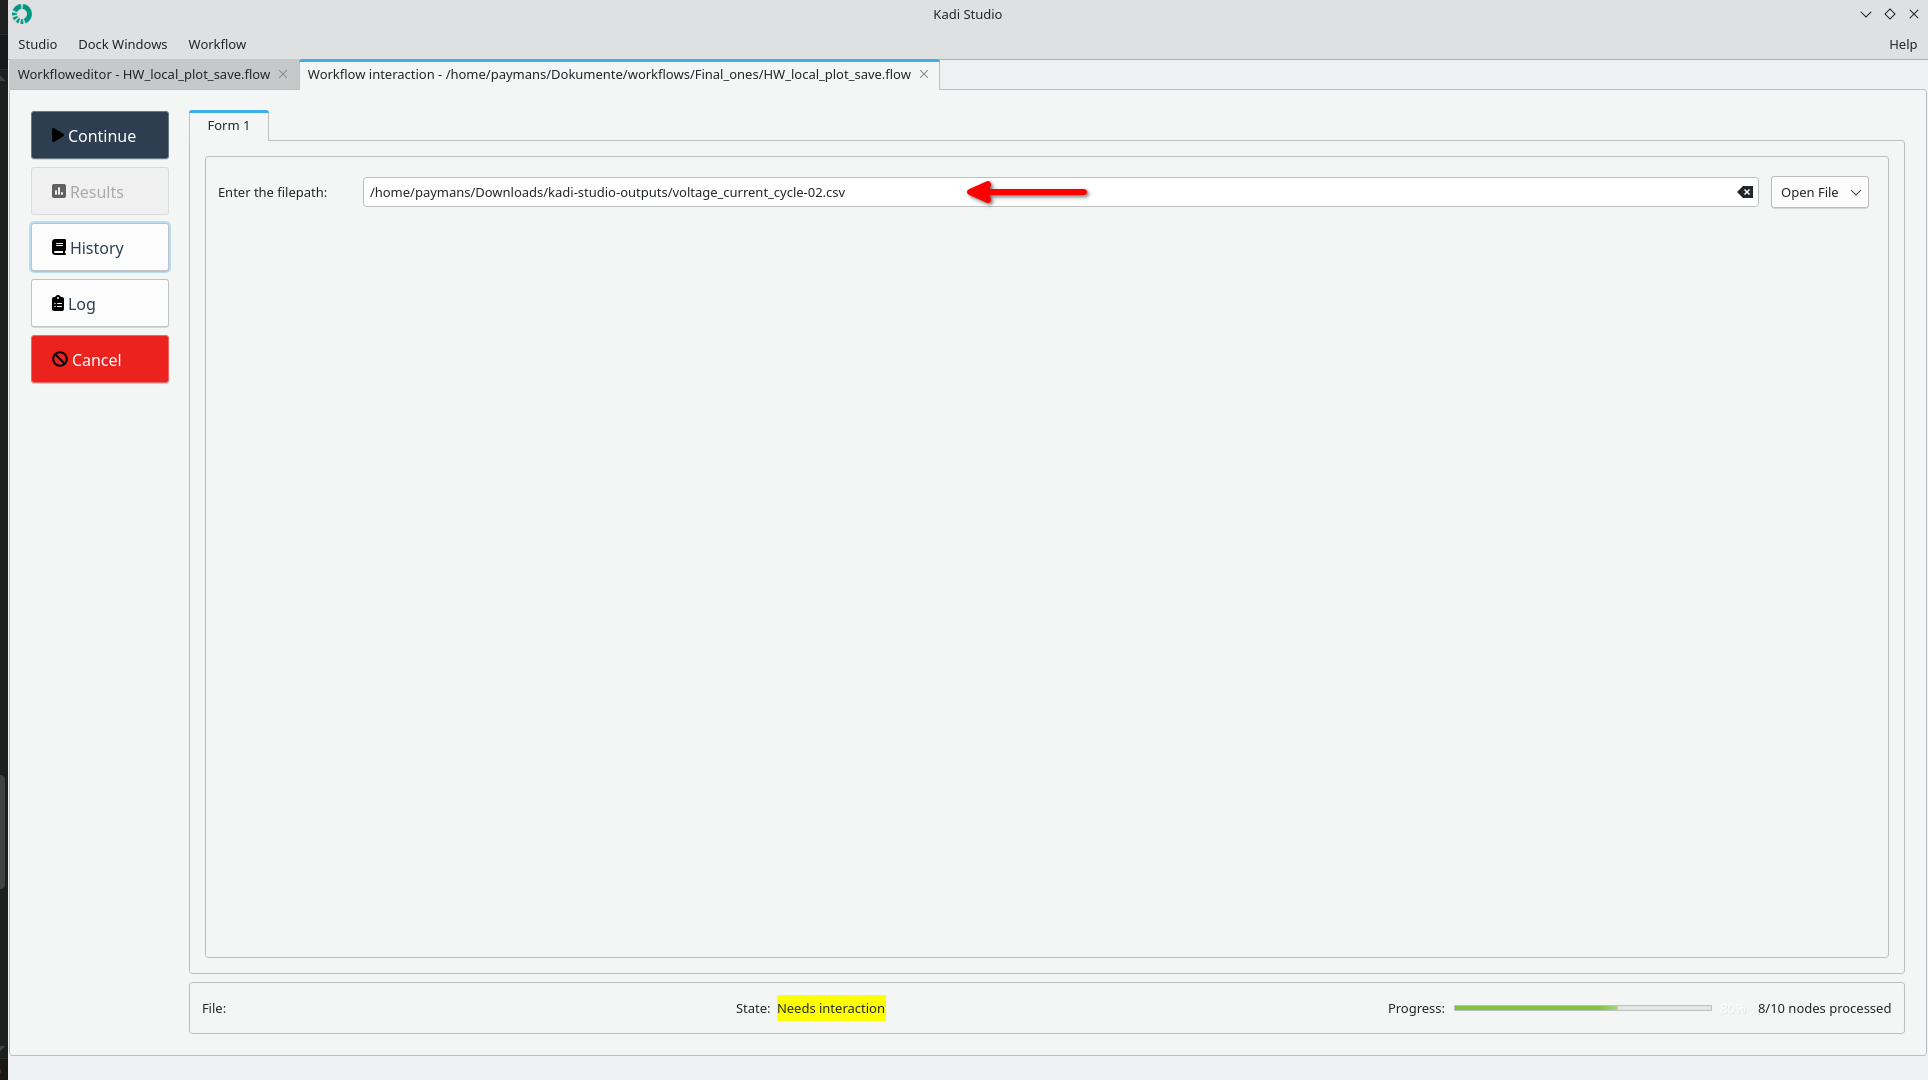
4- Status: Finished
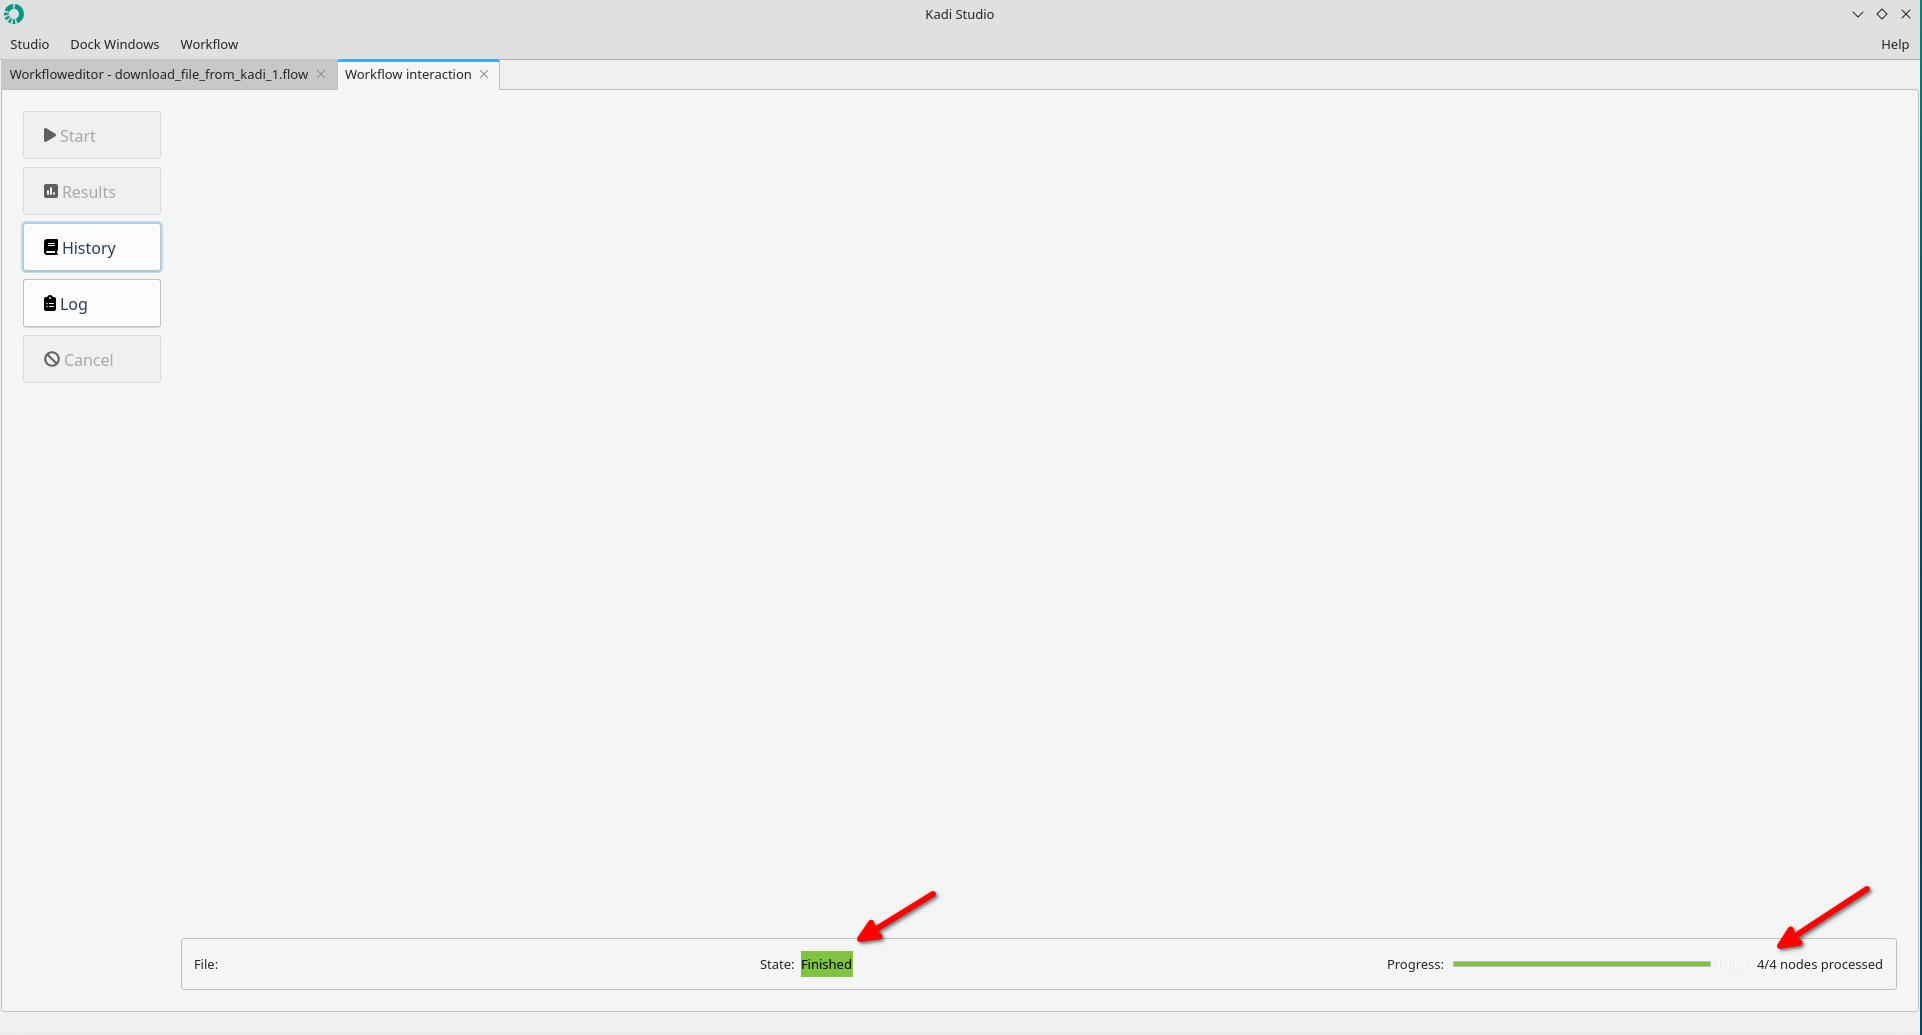
5- The plot is stored at the specified path.
Done.